Speeding up Leaflet Markers
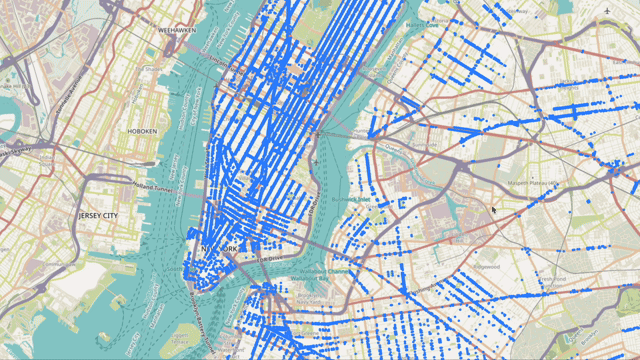
I recently published a map of the collection of wastebaskets in NYC. Initially, I was curious about whether I can show that the density and availability of wastebaskets vastly differs depending on which borough you are in. It was a project that helped me understand how to work with geospatial data, everything from downloading OSM layers and objects, querying PostGIS, and understanding the conversion between different mapping projections. But right now I’d just like to discuss the performance of map markers on Leaflet.
The dataset I was displaying contained over 20k points, and displayed terrible drag performance when being added in the canonical way:
|
|
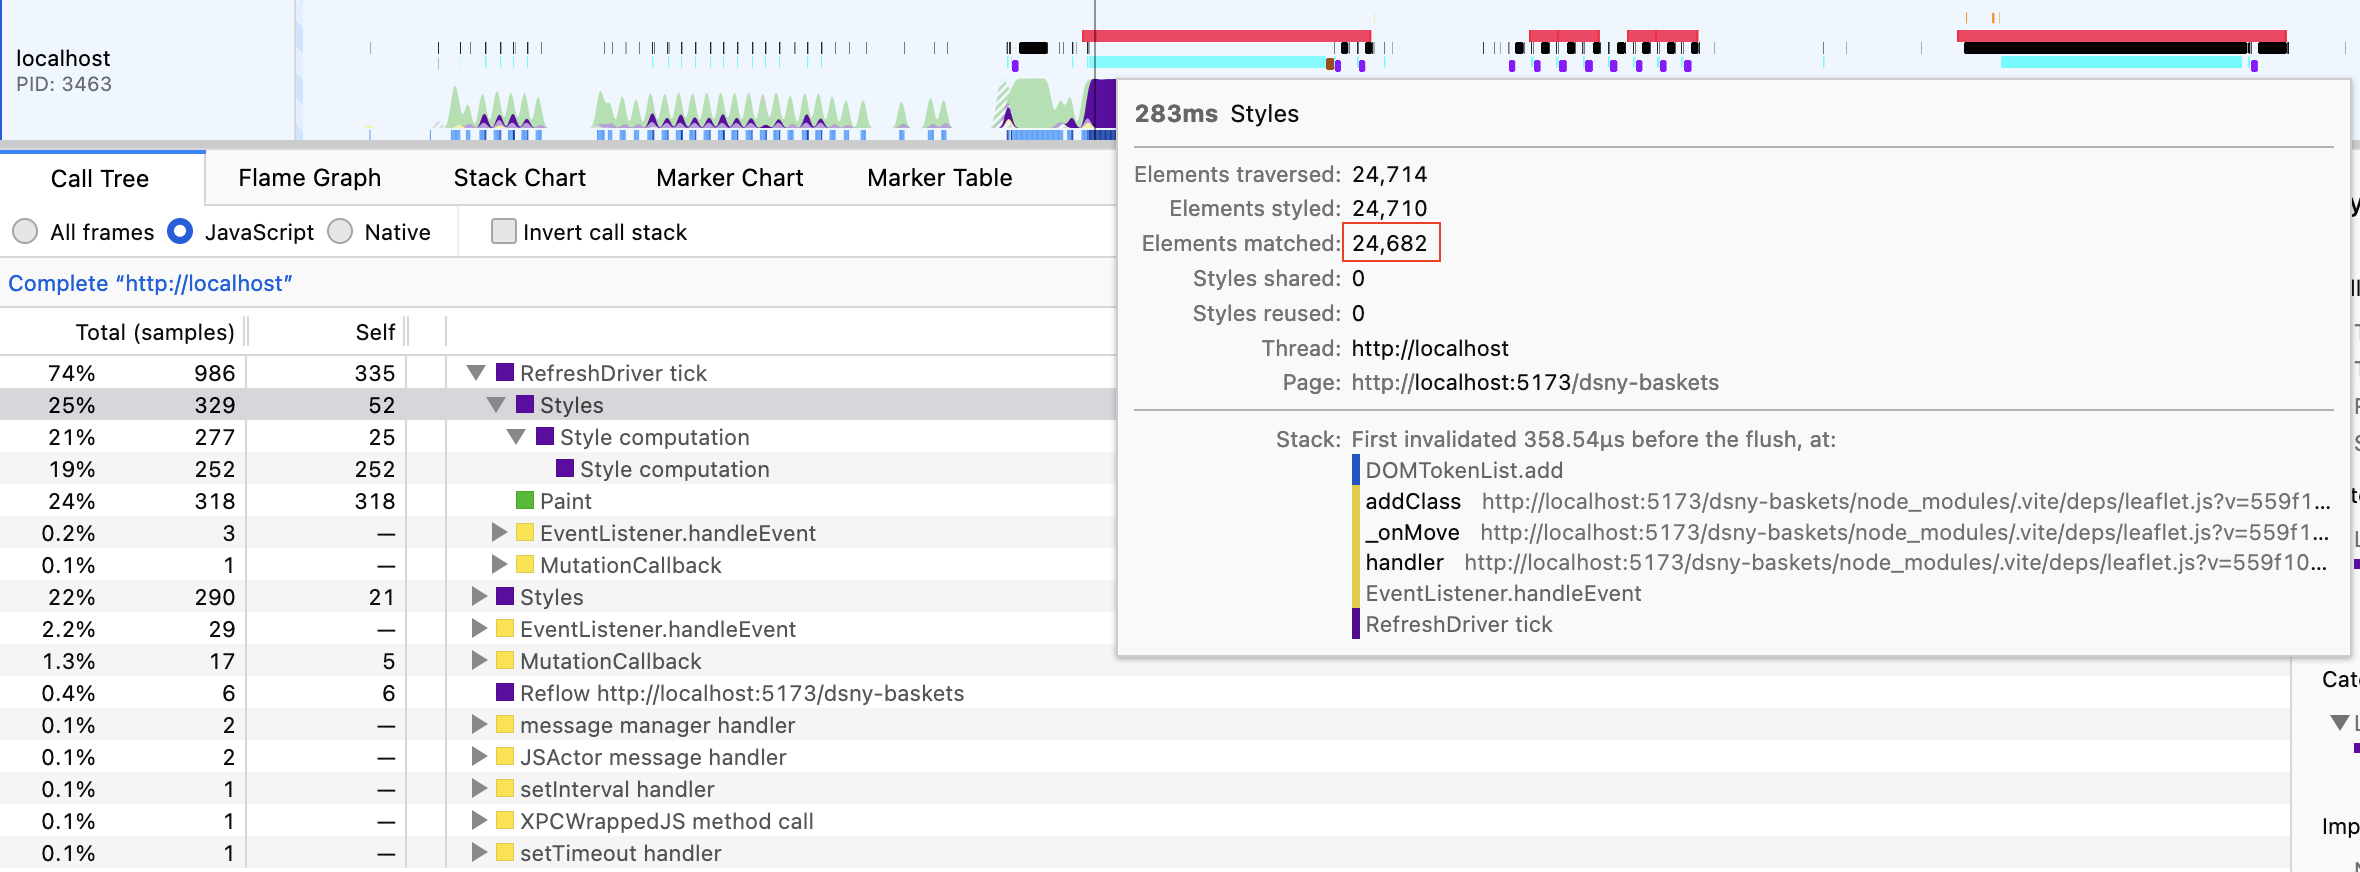
Notice how the the image lags behind the pointer by several seconds. After digging through the source code in vain, I realized that the issue lay in a ‘style flush’. Looking at the profiler more closely, we see that the style flush was caused by adding a class in the _onMove handler of the layer.
This profiling was done retrospectively - while I was working on my visualization, I wanted to speed up the interactivity of map. A tried and true way to do this is to reduce the number of points I was showing on the map. I tried heatmaps, clustering, and even a novel approach by showing the roads that were ‘serviced’ by wastebaskets. I considered sampling but it would need to be fairly intelligent, since I would only want to reduce the density of points only in already dense parts of the map. Nothing felt as clear as displaying the points directly on the map. So what I ended up doing instead was rendering a raster image of the points.
Rendering map points
To do this, we first calculate the extent of our displayed data. This gives us a lat-lng rect that we can then use to compute the aspect ratio of the image we want to generate:
|
|
We then take two random points, in this case we just take the first two points:
|
|
The variable pxInMeter is the distance in meters, in the map’s CRS, between the two points. This is used as a scale factor, which we use to determine the size(in pixels) of each marker.
|
|
And last but not least, we render the image using the canvas.toBlob function and we return as a url which we then display on the map at the extent that we calculated earlier:
|
|
This technique works pretty well, and manages to draw the load the image within 3s, with no issues with drag performance.:
Try it here. Now this obviously introduces some other issues, namely that we now have to hit test for any interaction, and that since the marker is a raster, we will see pixelations as we zoom in. In the future I think this can be combined with Leaflet.LayerGroup.Conditional could allow us to show actual markers when zoomed in enough such that the number of markers are drastically smaller, or we could only render the points that are onscreen at any given point, and updating as the map bounds changes.