Some notes on matplotlib
Matplotlib has two modes, ‘implicit’, and ‘object oriented’. Most code I know seems to use the ‘implicit’ method, which is to say, they use
|
|
Now, plt.figure is nice, but an implicit Axes object is created, and its kind of hard to get that object back. You might want Axes, so you could get the range in data coordinates, of the plot. So instead of using figure, use subplots:
|
|
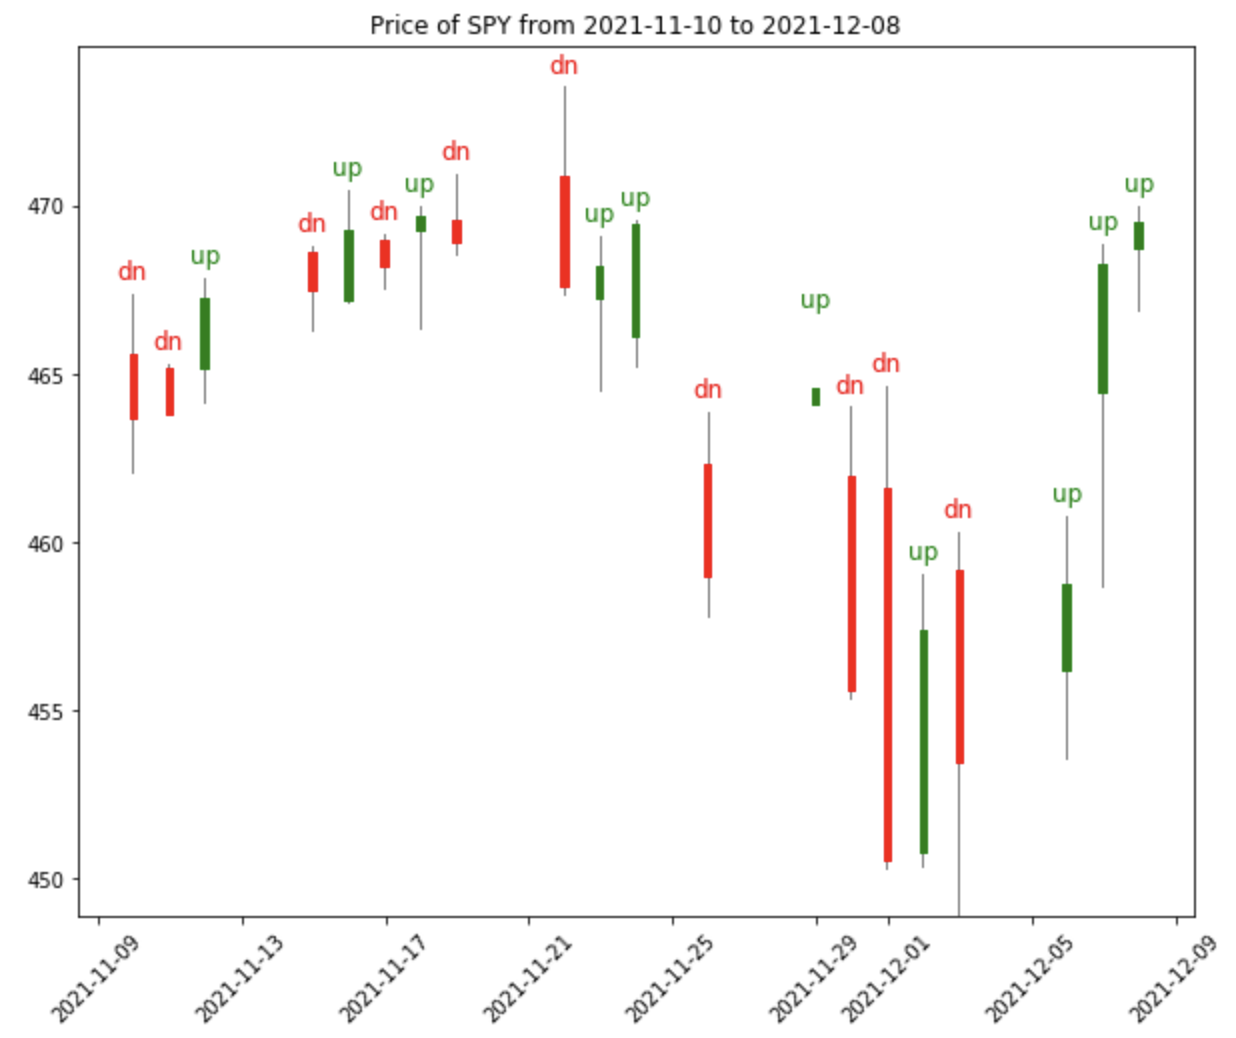
I needed this to reposition some labels offset from a bar chart:
|
|
It turns out this tom-foolery is not actually needed. matplotlib.Text allows us to specify in addition to an xy, an xytext and textcoords, which is the ‘coordinate system that xytext is given in’. This allows us to do:
|
|
Now, this is nice. xytext is specified in ‘offset points’, so no crazy conversion needed. But notice that this function is matplotlib.pyplot.annotate, not matplotlib.pyplot.text!
And the signature is completely different! matplotlib.pyplot.text is x,y,str,**kwargs and matplotlib.pyplot.annotate is str,xy,**kwargs. Go figure.
Also, it turns out that 3.5.0 has bar_label, so depending on the matplotlib version you’re on, you may be able to just use that. In any case, the deep dive into the source was fun.